I have been trying to get my head around the application of matrices in colour space transforms. As a learning exercise I thought it would be simpler to loose a dimension and plot the results on a 2D graph. The code is not mine, but I have been tinkering with it to get different results.
import numpy as np
import matplotlib as mpl
import matplotlib.pyplot as plt
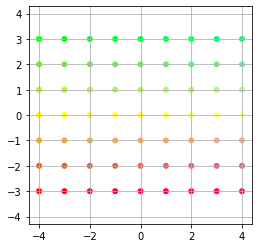
xvals = np.linspace(-4, 4, 9)
yvals = np.linspace(-3, 3, 7)
xygrid = np.column_stack([[x,y] for x in xvals for y in yvals])
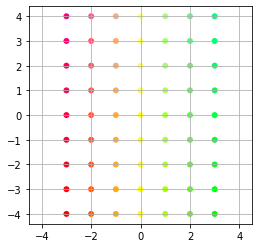
a = np.column_stack([[0, 1], [1, 0]])
print(a)
uvgrid = np.dot(a, xygrid)
Matrix: (0 1, 1 0) is a permutation matrix in which each row contains one entry of 1 and 0’s elsewhere. The effect of which changes the order of each element in the dataset.
def colourizer(x, y):
    r = min(1, 1-y/3)
    g = min(1, 1+y/3)
    b = 1/4 + x/16
    return (r, g, b)

colours = list(map(colourizer, xygrid[0], xygrid[1]))

plt.figure(figsize=(4,4), facecolor="w")
plt.scatter(xygrid[0], xygrid[1], s=36, c=colours, edgecolor="none")
plt.grid(True)
plt.axis("equal")
plt.title=("Original grid in x-y space")
Here is our starting grid of equal spaced points
plt.figure(figsize=(4,4), facecolor="w")
plt.scatter(uvgrid[0], uvgrid[1], s=36, c=colours, edgecolor="none")
plt.grid(True)
plt.axis("equal")
We apply out transformation matrix to the grid and re-plot the result. As you can see the permutation transformation has taken place.
Application to colour
The above example is a simplified demonstration of how colour transformation matrices work. These are often 3x3 matrices and are applied to the 3D colour cube axis XYZ each representing RGB. When the vector is applied the resulting 3D cube is scaled to meet the bounds of the transform.
There is more to learn about this subject, I hope to be able to modify this code or use it as a starting point to develop my own version that visualizes 3D linear transformations. Another topic that I am also keen to study is interpolation and how it is applied in colour science, particularly it’s use in 3D look up tables.